Adventures in Advent of Code and ImageMagick
Once again, I’m enjoying some late nights coding subjecting myself to Advent of Code this year. You can follow my progress by checking out my code here.
Day 5 had an interesting challenge. At a high level it can be somewhat summarized by being given a set of pairs of coordinates, each pair being a start and end point of a straight line. The goal of the challenge is to essentially find the number of times lines overlap/intersect at least twice.
My solution was rather naiive - quite simply iterate over every line and “draw” the complete grid. I also had a small function to dump the contents of the grid to screen in simple text format. During debugging this was handy to compare to the sample output of the question, but at the end of the challenge I noticed this also produced an interesting design of my own dataset.
After completing the challenges, there’s something about a few of them that catches my interest and leads me to spend a bit more time playing with them. For example last year I re-implemented day 2 using a preview version of Ruby 3 (granted, less than a month before final release) and using Ractors.
Day 5 this year got me thinking of other ways to visualize the output, which led me to dip my toes into RMagick, “Ruby bindings for ImageMagick”.
Of course, a simple way to visualize this data would be to simply take the input coordinates and generate a vector image (like SVG). As vector images are generated with primitives like lines and cirles, just using the start and end points for each line didn’t feel “right”. I wanted to do this using the solution data itself, not just the input data as it was given.
The “final” code (which is stil very rough) looks something like this

Let’s break this down and take a quick look at each section.
Input
For the most part this is pretty straight forward and not really “complete”, just being shown here for illustration purposes. rows is an array of arrays of (mostly) integers. Each element of the outer array is a “row” of squares, and each nested value is the number of times that a specific square is crossed by a line. If the value is . it is a 0. So essentially the data would look something like
[
  [ '.', 1, 2 ], # "0th" row with values of 0, 1 and 2
  [ 2, 2, 1 ], # 1st row with values of 2, 2, 1
]
max_overlap is just the highest value of all squares. This could be caluclated again by inspecting the rows data, howevever it’s more efficient to find this already when building out the rows data initially and just pass the value along, so that’s what I’m doing here.
Generating the colour map
I wanted to add a bit of variety of colour (or shading) to the image. There are obviously a few different ways I could go about this, but for something simple I figured I could treat each unique value of number of overlapping “counts” as a different colour.
As mentioned, the input data max_overlaps is the highest possible value, and to avoid having to recreate the colour for each square, we can just iterate over a range of 0 to max_overlaps, generating the colour (or Pixel objects in RMagick terms). When we need to then find the colour to be used for a given square, that squares’ value in the rows input data can be mapped directly to an item in the colour map array.
I’m also using Random#rand to randomize the colour, multiplying it by RMagick’s QuantumRange constant which defines the maximum RGB value.
Obviously a map would probably be a more efficient way of doing this as the data is being accessed so frequently, but just for an array this size (max_overlaps was only 6 in this case) I wasn’t too concerned about the performance.
Generating the image
This block is fairly straight-forward. After creating the initial Image object, we then iterate over every row of data, and every “column” of each row. This gives us everything we need to set a pixel colour - the x and y coordinates of the pixel we’re trying to set, as well as the “overlap” value of that pixel which we can use to find the colour to set by looking it up in the colour map defined earlier.
And finally we can pass a path in to the #write method to save the image to disk.
Wrap up
And with that I was able to generate randomized images from this dataset using Ruby and ImageMagick! It was a fun little exercise to get a taste of how it is working with ImageMagick (easy! Albeit this is a pretty simple/contrived example).
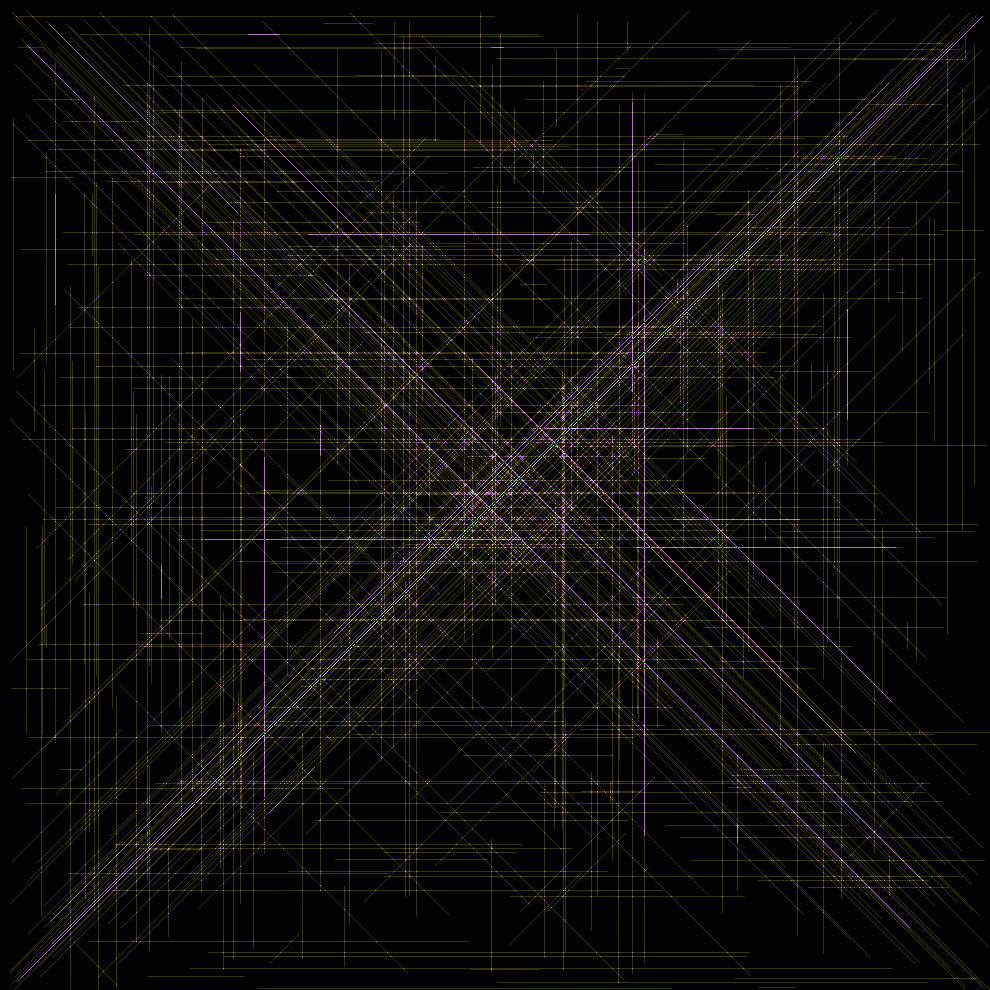
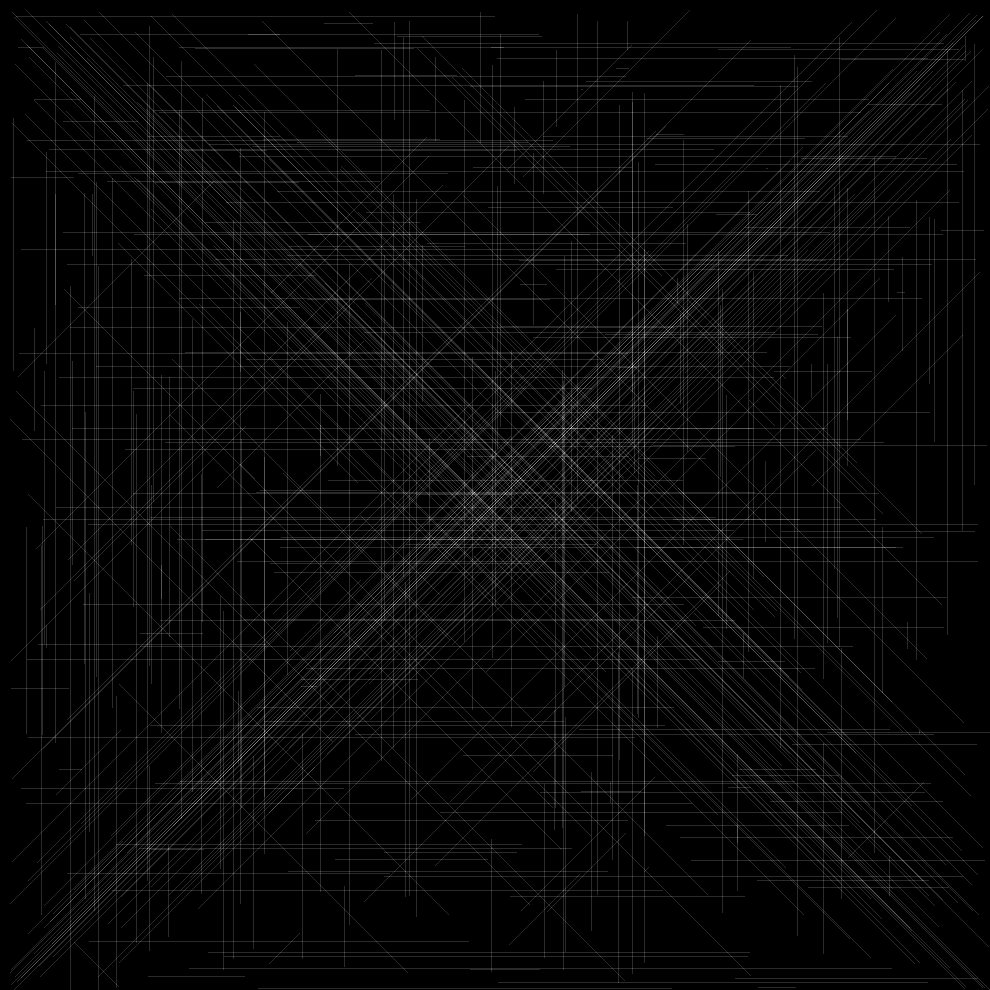
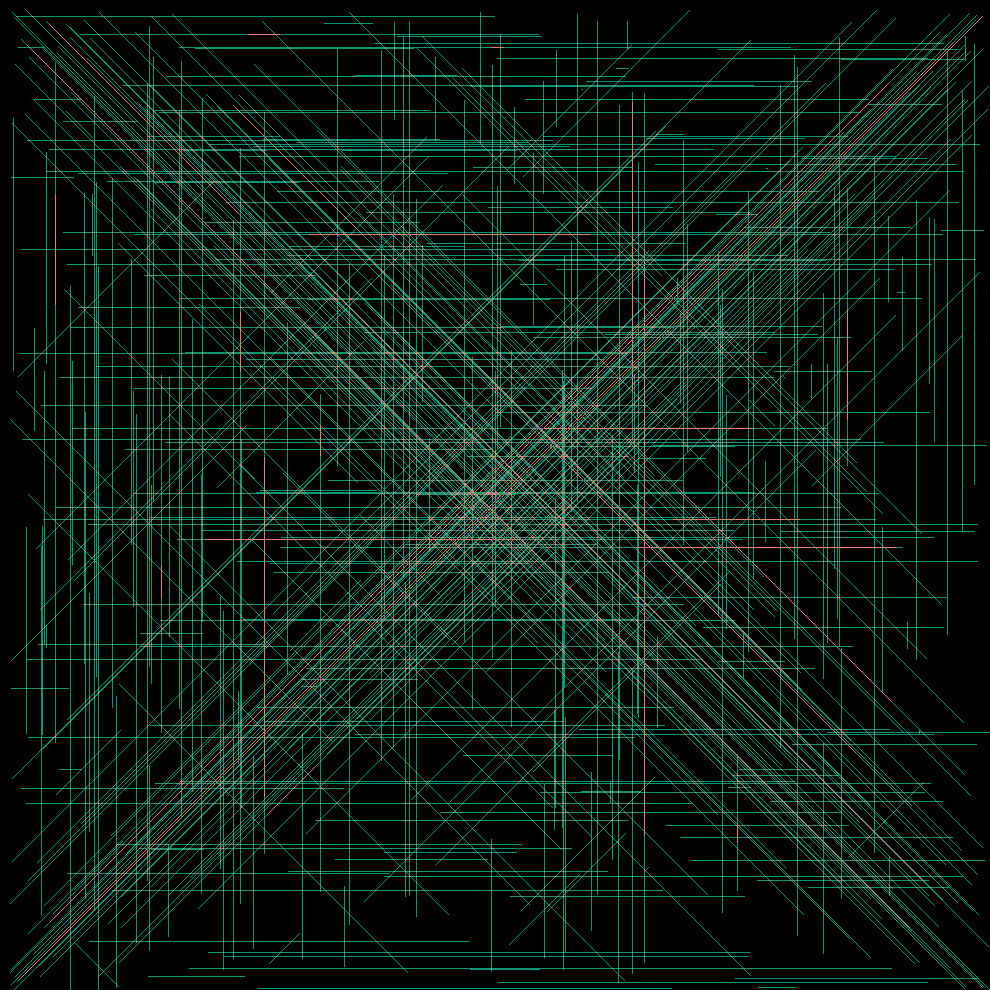
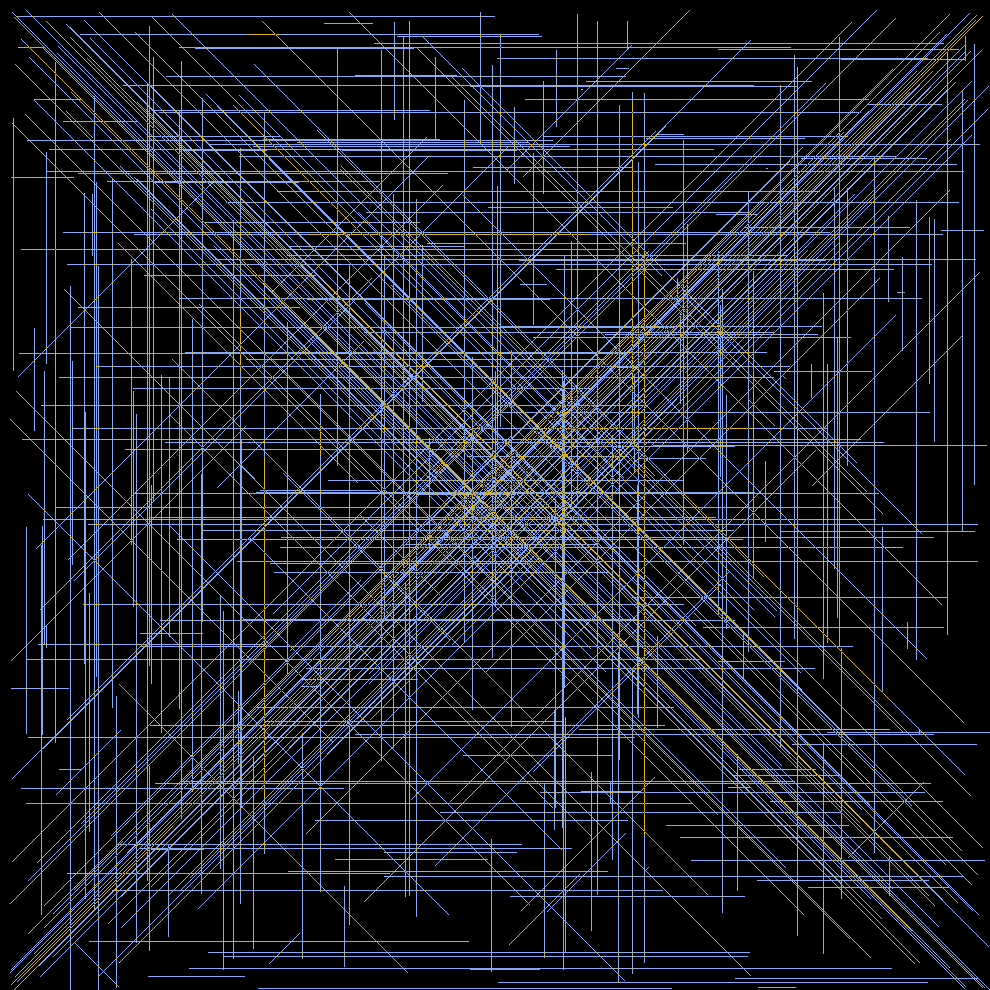
Here’s a selection of a few of the generated imges with random colours.
There’s still another idea or two I have around what I could do with this dataset that I might try out. And if another puzzle this year comes up in AoC that could do something similar I’ll definitely take a look to see what kinds of images they can generate.
If either of those happen I’ll try to share the results here as well.